Anil Bawa-Cavia
Social technologist, former last fm developer
Urbagram
His previous work at last FM was about big data, mapping, and collaborative filters.
Living cities are mostly invisible.
We think of cities as what is visible: roads, buildings, infrastructure. But cities are also made of flows and interactions: Poeple, goods, vehicles, etc. What are the interactions between these duel entities?
The living city is unplanned and is in conflict with the planned pavement. Everything unplanned is the living city.
Desire paths of data.
interactions
boundaries
flows
Thinking about the social life of the city, they analyzed data from Foursquare (that's a pretty specific subset of citizens) When you visualize this data, you see social hubs and walkable cells. Most people are happy to walk 7 minutes.

You can use this data to compare the social lives of different cities (so far, this data is not telling me anything I didn't already know about Manhattan, London, or Paris. Srsly. Anybody living there could have drawn these maps without any data set whatsoever.)
Cities feel fragmented when you can't walk from A to B.
Paris has fewer big clusters. It is more continuous than NY or London. Parisian foursquare users don't cross the Perif' (Nobody does. Again, nothing new to anybody who lives in Paris)
They were given access to cell phone data to study. They mapped out who is calling whom most. This is an example of a way of redrawing boundaries.(Now this is interesting!) Communication boundaries rather than political boundaries. (You know I love everything that hits political boundaries with the fuzzy warmness of more meaningful boundaries.)
You can find ways of making real pictures of neighborhoods.
Flows
He showed a beautiful animated map of the London bus system. When you look at this, you see the historical center of the system affecting the flow still today.
Build a macroscope. Take a step back and see the city as a single entity.
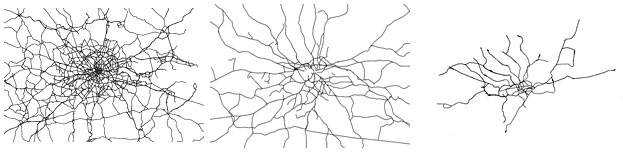 Mapping the subway data shows how the city moves, Synchronized in the morning rush hour, less at night.
(really lovely visualization here). This comes from rfid data from people using train cards. They have 2 million public samples and they also get extra research data. 300 million trips. (Wow)
They also looked at real-time bike share data. Volumes of flows, which bike stations are full and which are empty when.
(I would like to hear more concrete examples of how this big data modeling is used to solve real concrete problems or discover real useful conclusions that surprise us or are counter-intuitive. So far, the data is only reinforcing for the most part what any regular member of the living city knows intuitively. The pictures are pretty and all, but... I do want to know what the purpose is. Also, when is processing the data worth the effort is what I am wondering. If it only tells you what you already know, how is it useful? In predicting things about places you don't know? Maybe. Anil gave a good concrete example of using the public transit data to minimize system disruptions, but his real answer was that he is a researcher so it is not his responsibility to find applications for the information. That is up to engineers, designers, and industry.)
Making the living city tangible and knowable is their goal. When we know the living city, we can make the infrastructure responsive to it.
(This is an interesting goal, and a pretty good one on its surface. I do have the feeling that there is a tendency to say, "Here's data! What can we do with it?" instead of saying, "Here is an urban failure! What kind of data could help me fix it?" I'm a pragmatic designer-person, so this rubs me the wrong way.)
1 Comment:
-
February 27, 2011 at 1:09 PM
Very new to this notion of urban planning/understanding. Recently visited New Orleans for the first time, would be interested to see how natural disaster (Katrina, etc) and political unrest (Egypt, etc) affect the living city.